How to analyse a UK company before you extend credit: a worked example
A real UK company, real filed accounts, and a real CIQ Score. What the raw data showed and what the analysis concluded.
A new customer wants 30-day payment terms; they are a UK tour operator, making around £25m in revenue and they have been trading for a decade. The order is worth having, the question is whether you will get paid.
This is the decision credit controllers and finance teams make every week, usually with limited time and limited information. If you want the method in full before the worked example, see our guide to checking a company before extending credit terms. Here is a worked example of how to analyse a UK company before you say yes. A real company with real filed accounts and the real analysis CompanyIQ produced. We have hidden the name, because the point is the method, not the company.
What the raw data shows
Start where most people start: the filed accounts on Companies House. Pull the headline figures for this company and three things jump out.
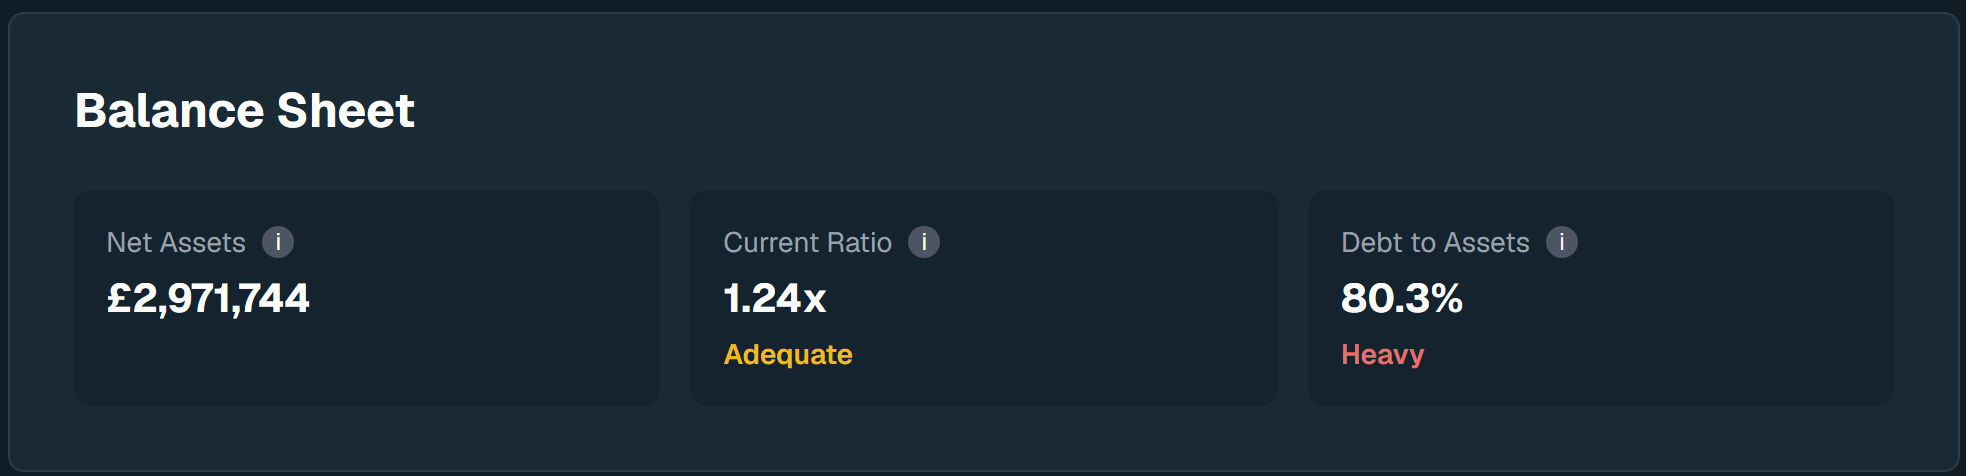
Total liabilities are 80.3% of total assets. A current ratio of 1.24, which is thinner than the 1.5 most credit policies like to see. And two late accounts filings in the recent history.
Plenty of credit policies would decline on the first number alone. An 80% debt-to-assets ratio reads as a heavily leveraged business, and heavily leveraged customers are the ones who leave you unpaid when things go wrong. If all you have is the raw data, that is where the analysis ends, application declined, order lost.
What the analysis concluded
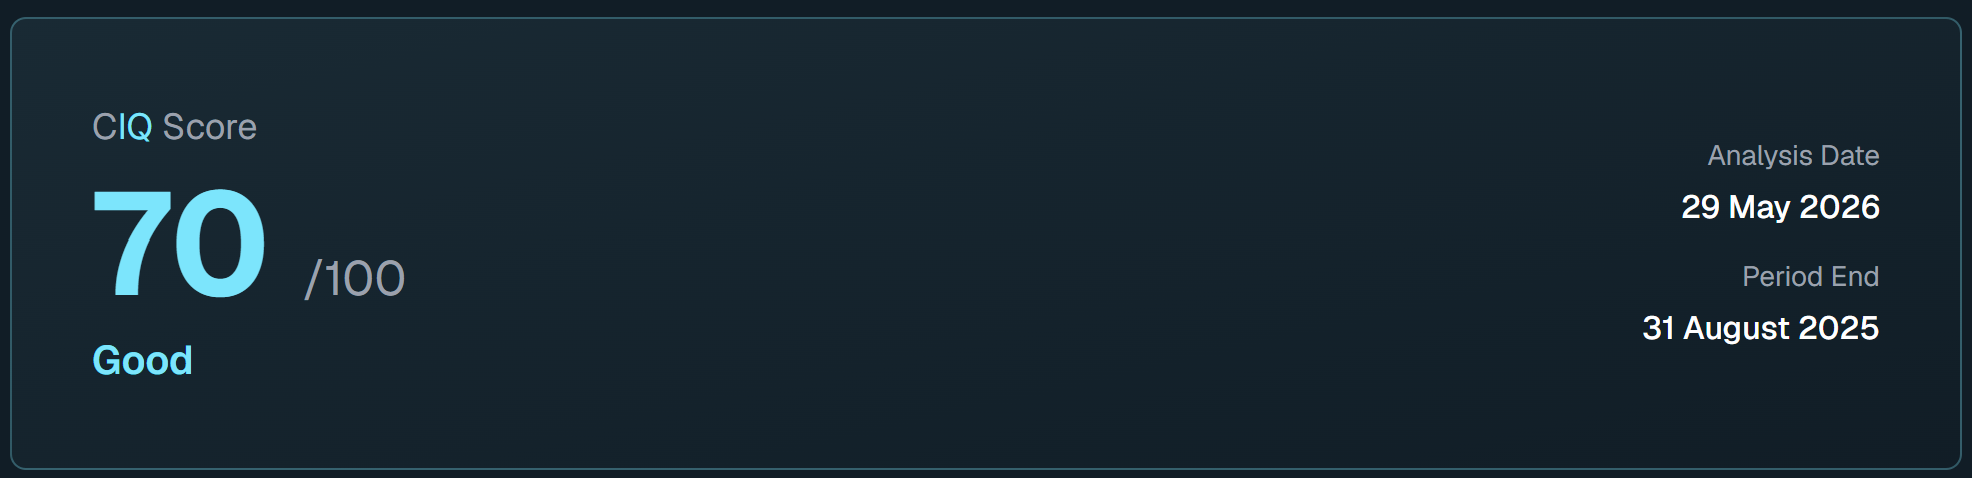
CompanyIQ scored the same company 70 out of 100. Good. A company you can extend terms to with normal monitoring.
That gap, between what the raw numbers suggest and what the analysis concluded, is the whole point of this article. So let us walk through how the analysis got there.
The five things that mattered
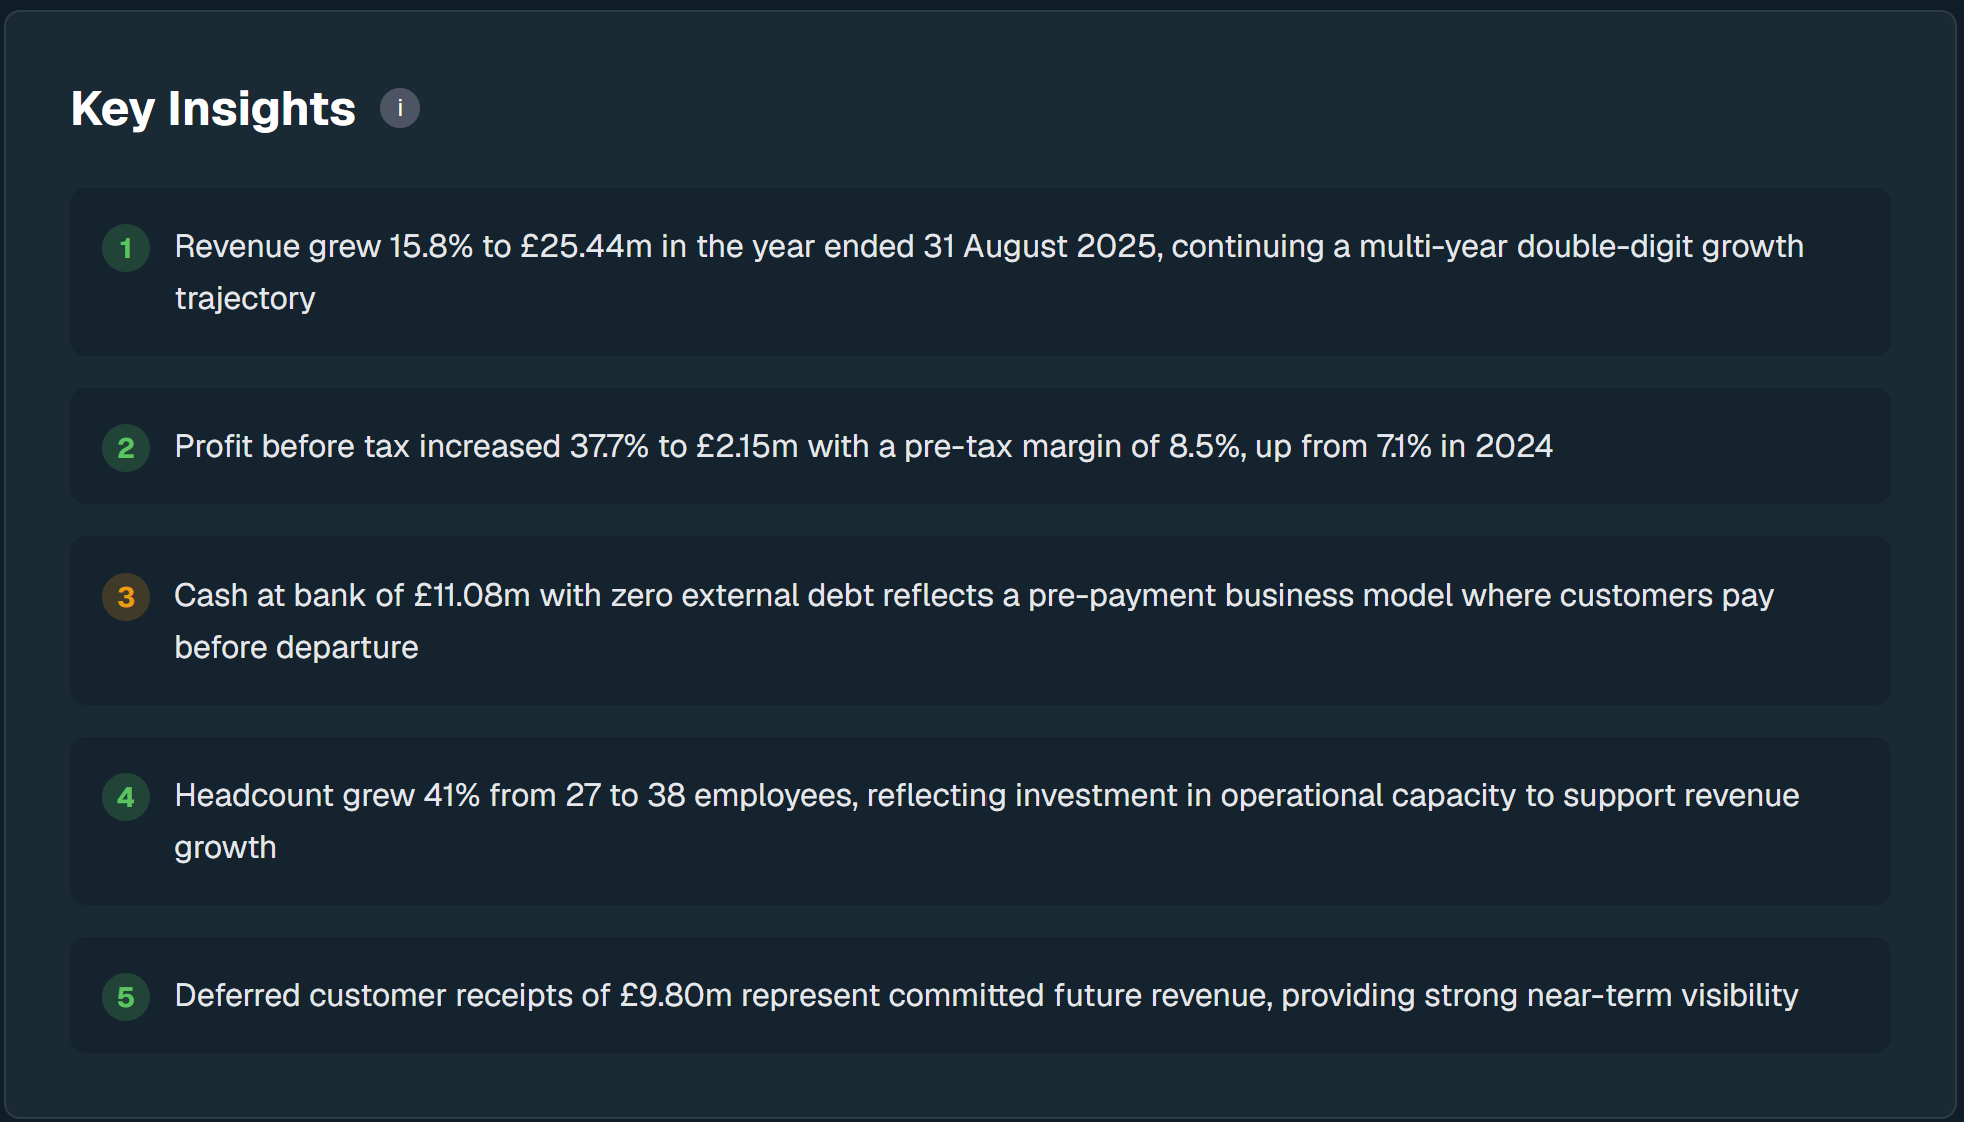
The analysis reads the full filed accounts, the strategic report, the notes, the filing history, and the director record. For this company: revenue up 15.8% to £25.4m, continuing a multi-year run of double-digit growth. Profit before tax up 37.7% to £2.15m, with the margin improving from 7.1% to 8.5%. Cash at bank of £11.1m with zero external debt. Headcount up 41%. And £9.8m of deferred customer receipts, which is committed future revenue already sitting on the balance sheet.
Notice the third and fifth insights. They are about to do a lot of work.
The 80% leverage that is not debt
Here is the number that would have killed the application. The analysis flags it: 80.3% is above the threshold where leverage becomes a concern, and it is raised as a high-severity risk signal with the exact balance sheet evidence behind it.
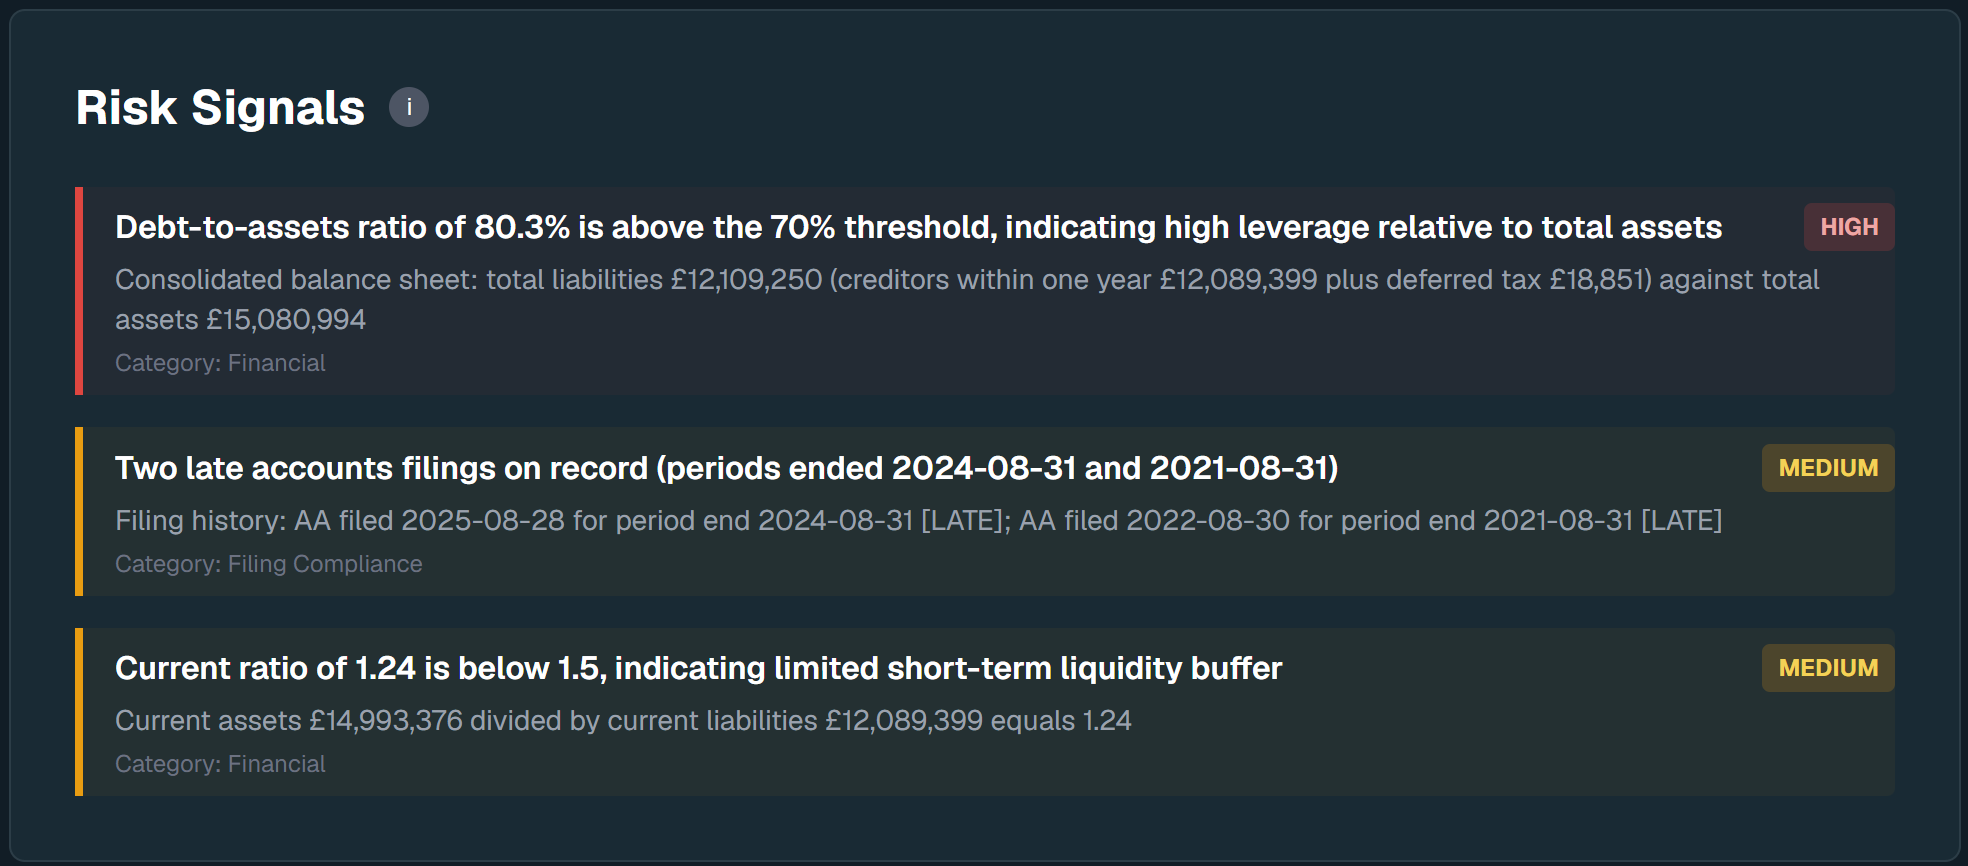
But the analysis does not stop at the ratio, it reads the structure of the balance sheet and identifies what the liabilities actually are. The overwhelming bulk is £9.8m of advance receipts from customers: holidays paid for before departure, held as deferred income. This is not borrowing. There is no bank debt, no loans, no external finance at all. It is the normal shape of a tour operator balance sheet, where customers pay up front and the cash sits as both an asset and a matching liability until the holiday happens.
Read that way, the scary number inverts. The £9.8m is not money the company owes a lender. It is confirmed bookings, money already collected for future trading sitting alongside £11.1m of cash. The liability that made the company look fragile is actually evidence of demand.
This is the difference between data and analysis. A data platform shows you 80.3% and lets you draw the wrong conclusion. The analysis tells you what the number is made of, flags it for your attention, and gives you the context to judge it properly. Both things are true at once: the ratio is high, and the cause is benign. A good analyst would tell you both, so does the report.
The growth picture
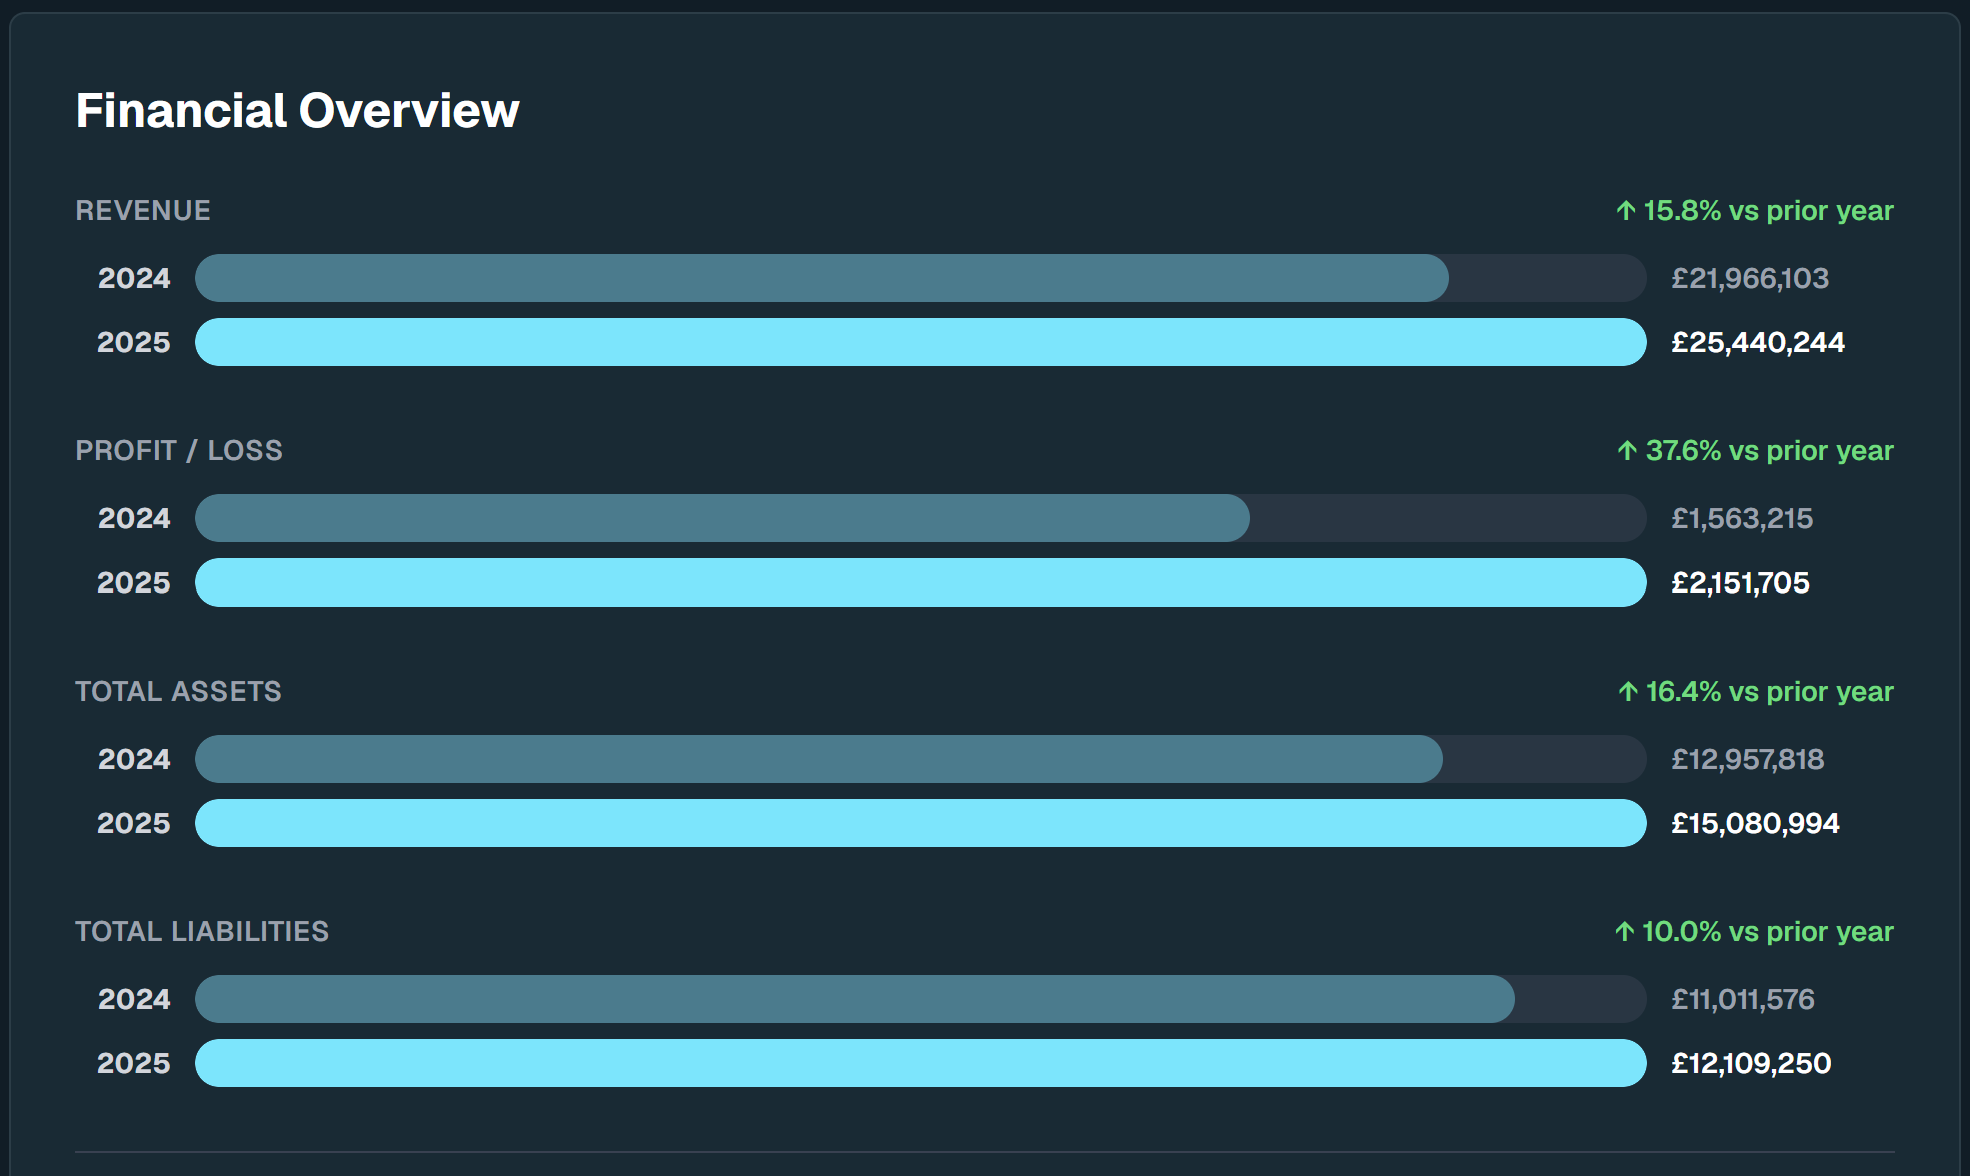
The trading picture supports the score. Revenue growing ahead of 15%, profit growing more than twice as fast as revenue, gross margin improving from 29% to 31%, and interest income surging on the back of strong cash balances. The company is also investing in capacity, with headcount up from 27 to 38.
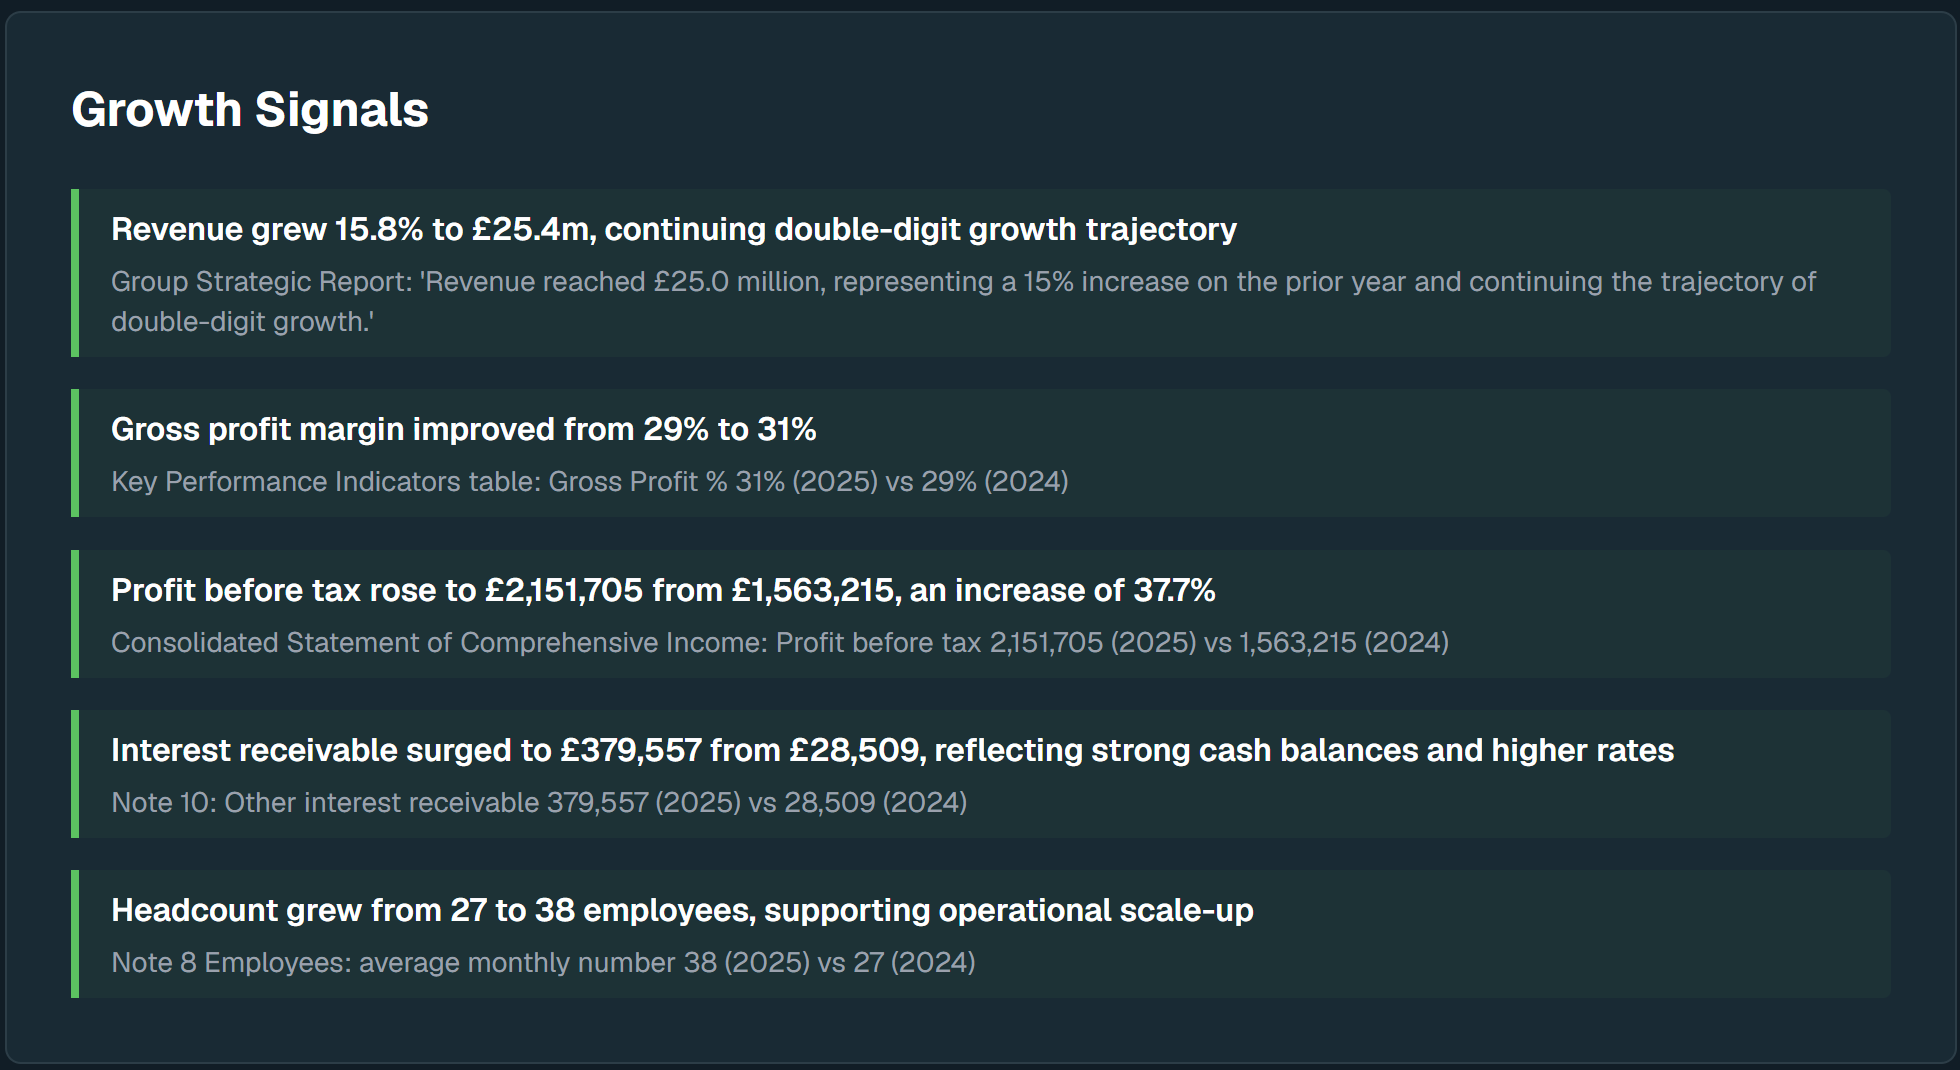
Every one of these signals carries its evidence: the statement it came from, the note number, the exact figures. Nothing is asserted without a source you could check yourself.
The board

Leadership stability matters to credit risk more than people give it credit for. Churning boards, short tenures, and directors trailing dissolved companies behind them are all patterns that show up in businesses that fail. Here the analysis found the opposite: founder-led, over a decade of tenure, no disqualifications, and no insolvency links. Excellent stability, zero red flags.
The ambers
A score of 70 is Good, not perfect, and the analysis is clear about why. The current ratio of 1.24 means the short-term liquidity buffer is thinner than ideal, even allowing for the deferred income effect. And there are two late accounts filings in the history. Neither is a dealbreaker. Both are exactly the kind of thing a credit controller notes and monitors: if the late filings become a pattern, or the liquidity buffer tightens further in next year’s accounts, the picture changes.
A report that only showed you the good news would not be worth reading. The value is in seeing the strengths and the watch items together, with the evidence for each.
The decision
So, back to the question. A new customer, 30-day terms, the order worth having. The raw data said decline: heavy leverage, tight liquidity, late filings. The analysis said something more useful: a growing, profitable, cash-rich business with no external debt, a stable board, a forward book of £9.8m in committed customer receipts, and two watch items to keep an eye on.
Extend the terms. Monitor the account. Keep the customer.
Now consider the cost of the other path. Declining this customer on the leverage number alone means turning away a £25m business that pays its suppliers from an £11m cash balance. Bad credit decisions cut both ways: the customer you should not have trusted, and the customer you should not have turned away.
This entire analysis, the score, the signals, the evidence, the director assessment, came from one company check on CompanyIQ, most analyses complete in 60 to 90 seconds. The filed accounts are public; the judgement is the hard part, and that is the part the report does for you.
If you extend credit to UK companies and you want to see what your customers’ accounts are really telling you, run your first analysis at company-iq.co.uk.
Sign up for a free UK company analysis
CompanyIQ reads the filed accounts and returns a scored report in 60 to 90 seconds.
Run a company checkFirst analysis free, no card required. After that, £15 for a one-off or from £0.50 each on a plan.